The International Energy Agency (IEA), founded in 1974 within the framework of the Organization for Economic Cooperation and Development (OECD), published its 2023 Snapshot of Global PV Markets, 11th edition of the IEA reports on the development of PV all over the world, based on information from official government bodies and reliable industry sources. This “Snapshot of Global PV Markets” aims at providing preliminary information on how the PV market developed in 2022. Here are the main topics highlighted in the report.
Evolution of Annual Installations
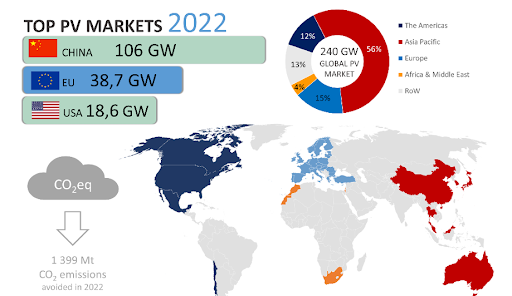
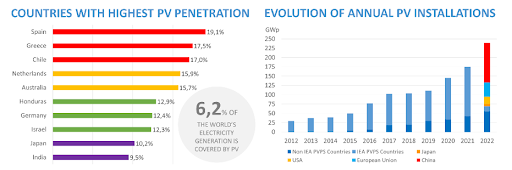
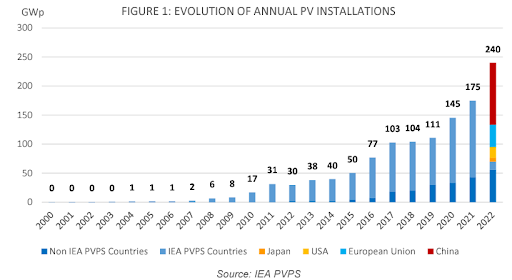
The global PV base once again grew significantly in 2022, reaching 1 185 GW (≈ 1,2 TW) of cumulative capacity according to preliminary market data. With 240 GW of new systems installed and commissioned, and nearly a dozen countries with penetration rates over 10%, PV has demonstrated that it is a serious, major, long-term contributor to cost competitive electricity generation and emissions reductions of the energy sector.
Major trends include:
- The Chinese market continues to dominate both new and cumulative capacity and added 106 GW or 44% of new capacity to reach 414,5 GW of cumulative capacity, more than double that in Europe. This strong growth follows that of previous years - 54,9 GW in 2021 and 48,2 GW in 2020, and is evenly balanced between centralised and distributed systems.
- Europe demonstrated continued strong growth with 39 GW installed, led by Spain (8,1 GW), Germany (7,5 GW), Poland (4,9 GW) and the Netherlands (3,9 GW). High electricity market prices have reinforced the competitivity of PV and several countries have enacted policies to further accelerate PV in line with EU and national energy sovereignty engagements – whilst others are enacting policies to reduce injections because of grid congestion.
- The American market contracted to 18,6 GW under the combined influence of trade issues and grid connection backlogs, whilst Brazil installed a high 9,9 GW, nearly doubling the previous year’s new capacity.
- India once again showed strong growth with 18,1 GW, predominantly in centralised systems, and a PV penetration of nearly 10%. Strong volumes from Australia (3,9 GW despite supply chain issues), and Korea round out the regional market.
- Japan remained steady at 6,5 GW, the same as in 2021. Nine countries now have penetration rates over 10% with Spain, Greece and Chile above 17%, and whilst grid congestion has become an issue, policy measures, technical solutions and storage are already providing workable solutions to enhance PV penetration.
2022 market outlook
As mentioned, nine countries now have penetration rates over 10% with Spain, Greece and Chile above 17%, and whilst grid congestion has become an issue, policy measures, technical solutions and storage are already providing workable solutions to enhance PV penetration.
Individual markets remain sensitive to policy support despite competitivity across most market segments in many countries, however policy support is moving to indirect measures such as accelerated permitting, facilitating prosumer models or managing grid congestion. Increasing concerns about the concentration of the upstream supply chain in China has led to initiatives and policy support for local manufacturing.
PV played an important role in the reduction of the CO2 emissions from electricity in 2022, with two-thirds of added renewable capacity installed in 2022, resulting in over 50% of generation from new renewable capacity, and avoiding approximately 1 399 Mt of annual CO2 emissions, up 30% from 2021. This represents around 10% of the total electricity and heat sector emissions and 4% of all energy emissions. This continued positioning PV as one of the key existing and developing solutions to fight climate change.
Market segments
Preliminary data indicates that in absolute terms, both rooftop and utility scale segments grew in 2022. Market segments were balanced, with 48% of new capacity on rooftops. The share of the rooftop segment has been growing continuously since 2018, as markets open in new countries and decreasing costs makes it more accessible for residential and commercial investors, with notable volumes (>2,5 GW) and market shares in China, Brazil, and Germany as well as Poland and Australia. On both segments new applications are in growth: from Building-integrated photovoltaics (BIPV) in the rooftop segment to utility scale floating PV. Still marginal but growing, agrivoltaic projects and BIPV are as yet hard to quantify, as are VIPV/VAPV3 volumes (PV integrated in vehicles) although they are expected to develop well in the coming years. Technological evolutions, such as bifacial PV will also impact the development of these new market segments.
Cumulative installed capacity in the world
In 2022 the global cumulative installed capacity passed the symbolic 1 TW mark, reaching an estimated 1 185 GW. Frontrunners - from China down to India and then Germany (67,2 GW) have at least 30 GW more than the next countries. Their positions are unlikely to be challenged in 2023 or 2024, not even a doubling or tripling of Brazil’s dynamic 2022 market (9,9 GW) would be sufficient. Brazil joined the next group of countries with smaller, similar cumulative capacities of between 20 GW and 30 GW: Australia, Spain, Italy, Korea and now Brazil.
PV and Other Renewable Energy Evolutions
PV is playing a major role in the energy transition – in 2022 it represented two thirds of all new renewable electricity technologies, thanks to its consistent costs, technical performance and accessibility, and generally faster permitting procedures than wind or hydro. As installed volumes increase, so does workforce competency and investor confidence, allowing solar to be adopted as a safe, mature technology investment.
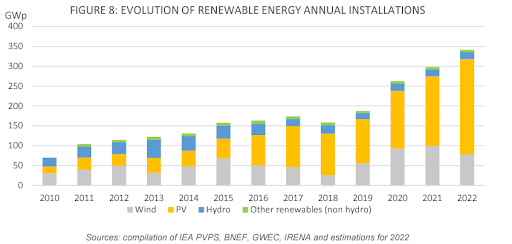
With the hindsight of the past three years, clearly solar is now a mainstream energy source. In 2022, solar PV generated approximately 50% of the total renewable electricity production from new production assets despite being two thirds of new capacity. The difference between capacity and generation is due to the different capacity factors of renewable technologies.
Sales Forecast for Single and Three-Phase Inverters in the EU and USA
As the world continues to transition towards clean and renewable energy sources, the solar energy market is expected to grow significantly in the coming years. One critical component of solar energy systems is the inverter, which is responsible for converting the DC electricity generated by solar panels into AC electricity that can be used to power homes, businesses, and other facilities.
Global Solar Inverter Market Forecast
According to a report by Research and Markets, the global market for solar inverters, including single-phase and three-phase inverters, is expected to grow at a CAGR of 14.86% between 2020-2025. The report also suggests that Europe is expected to hold the largest market share in the global solar inverter market during this period. This growth is attributed to factors such as increasing demand for clean and renewable energy sources, government incentives and subsidies, and declining costs of solar inverters due to technological advancements and economies of scale.
European Solar Inverter Market Forecast
Also other reports, such as the latest one on this topic by SolarPower Europe, forecasts that the European solar market will continue to grow in the coming years. The report also notes that the demand for three-phase inverters in Europe is expected to increase in the residential and commercial sectors. This trend is due to the growing adoption of rooftop solar panels in homes and businesses, coupled with the increasing need for more efficient and reliable solar inverters to manage and convert the electricity generated by these systems.
US Solar Inverter Market Forecast
According to a report by the Solar Energy Industries Association (SEIA) and Wood Mackenzie, the US solar market is expected to triple by 2030. The report suggests that the demand for inverters, particularly three-phase inverters, is expected to increase due to the growing commercial and industrial solar market in the country. This trend is attributed to factors such as declining solar panel costs, rising electricity prices, and government policies that incentivize the adoption of solar energy.
Solar Energy : a key role in the transition
According to the Bloomberg New Energy Outlook (NEO) report, solar energy is expected to play a crucial role in the transition to net-zero emissions by 2050. Here's a brief summary of the report's key findings on the future role of solar energy
-
Solar energy will be the cheapest form of electricity in most parts of the world by 2030, thanks to ongoing cost reductions and increased efficiency in solar technology.
-
By 2050, solar energy is projected to be the largest source of electricity globally, accounting for 40% of total power generation.
-
The deployment of solar power is expected to grow rapidly, with total installed capacity reaching 8,600GW by 2050, up from just 740GW in 2020.
-
Solar PV and batteries will become the cheapest way to provide electricity to more than 2 billion people who currently lack access to reliable electricity, particularly in developing countries.
-
The use of solar power will be crucial in reducing greenhouse gas emissions from the electricity sector, which is responsible for roughly 40% of global CO2 emissions. The report suggests that solar power will need to grow 16-fold by 2050 in order to meet the goals of the Paris Agreement.
Overall, the Bloomberg New Energy Outlook report predicts that solar energy will play a critical role in the transition to a net-zero emissions economy, providing cheap and reliable electricity to millions of people around the world while helping to tackle the urgent challenge of climate change.