
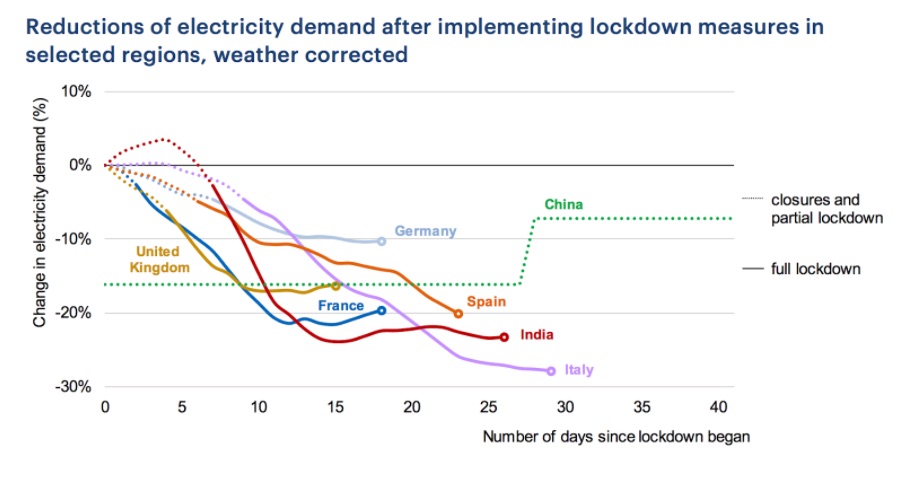
Over the course of the first trimester 2020, according to a report published by IEA, a 3.8% reduction in global demand for energy was recorded, caused by the Coronavirus epidemic, with levels reaching -20% in the hardest-hit areas such as China, Western Europe and the USA.
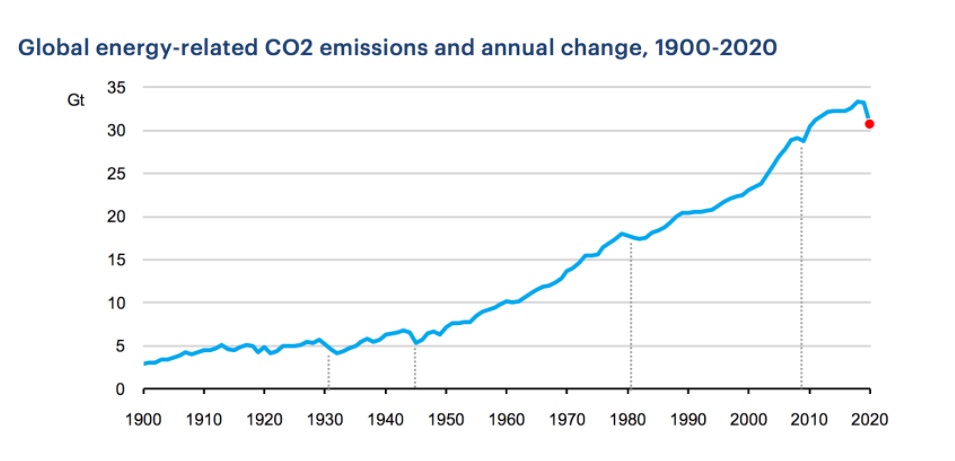
The emergency measures also produced a considerable reduction in greenhouse gas emissions caused by the lockdown, equal to about -1.8% on a global level, matching the levels of 2010.
Climate experts have clearly stated that such a reduction will have no impact on the effects of climate change.
Indeed, a few months with lower emissions are not sufficient to resolve a hugely complex structural problem, which would require decisive changes in the way in which we produce and consume energy.
Thus, everything points to the necessity of investing in renewable energy sources, in order to constantly reduce polluting gas emissions over time.
2,537 GW of renewable energy was achieved in 2019
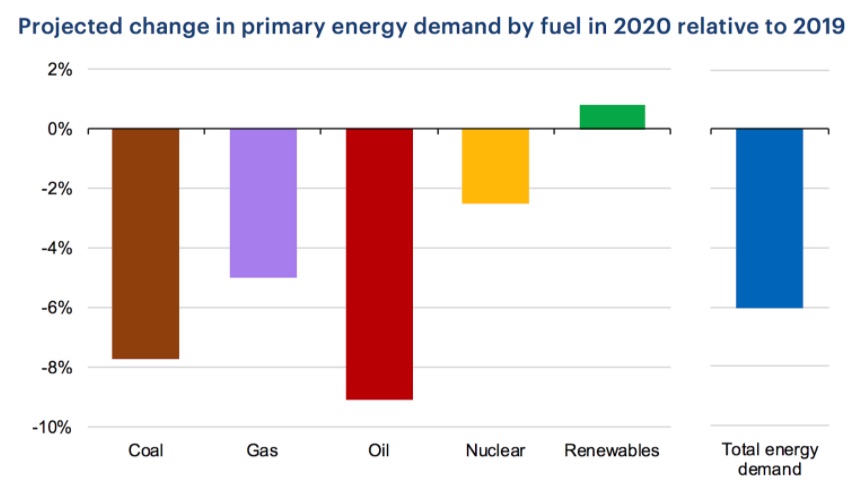
Whilst traditional energy sources (coal, petroleum, gas and nuclear) recorded a sizeable reduction in demand and in production at the beginning of 2020, renewable energies are the only ones to show an increase (approximately 1.5%) compared to the previous year, due to higher capacity installations.
As reported in “Renewable Capacity Statistics 2020” published by IRENA, the International Renewable Energy Agency, the capacity of renewable energies reached 2,537 GW across the world by the end of 2019, with an increase of 176 GW on the previous year.
That translates to 72% of the total capacity added last year, backed by investments that could achieve returns of 800%, with fossil fuels pushed into a marginal role as far as new installations go. This, in turn, means that the share of renewable fuels on the entire global energy production is between 26% and 28%, according to estimates made by the IEA.
If we broaden the period analysed, the production capacity of electrical energy from renewable sources has more than doubled in less than ten years.

The roles of solar and wind energy
The increase in the capacity of renewable energy production has largely been brought about by the growth in solar energy installations and wind turbines.
Sun and wind represent 90% of the additional new capacity, staking their claim as the most valued sources of renewable energy and the ones on which Nations count the most.
In detail:
- Wind energy: 622,704 MW reached in 2019, compared to 563,820 in 2018
- Solar energy: 586,434 MW reached in 2019, compared to 488,752 in 2018. Almost all this capacity comes from energy generated by photovoltaic panels.
What are the estimates for 2020
Unfortunately, due to the entirely unforeseen situation created by the Coronavirus epidemic, forecasts created in the past regarding production and demand for electric energy over 2020 have changed considerably.
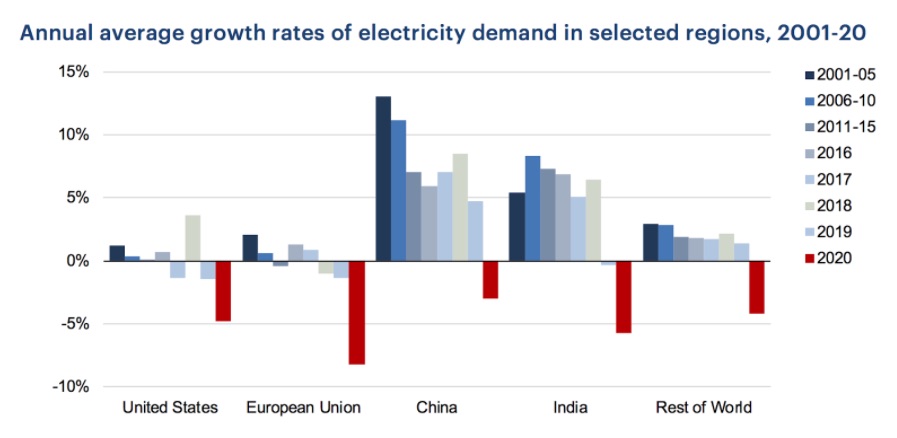
According to the IEA, currently we can expect global demand for electricity to go down by 5% in 2020. This will be the greatest decline since the Great Depression, and eight times greater than the reduction recorded in 2009 due the global financial crisis.
To date, renewable energy has been the energy source that has proved itself most resistant to the side effects of COVID-19, as illustrated previously.
Whilst all other energy sources will collapse, the IEA estimates the increase in the market share for renewable energies will be 1% in 2020 compared with 2019.
Taking into account the preconditions and the enormous economic uncertainty we are experiencing at the moment, it’s actually a really good number.
FAIST is happy to contribute to this much-needed change producing components and assemblies for wind turbines and solar inverters for PV systems.